The 3D Amperometry Window
The 3D Amperometry window displays a sample's
3D_Amp data, which is collected
using an ICS-3000 ED or ICS-5000 ED electrochemical detector in integrated
amperometry mode.
Use one of the following methods to display
3D amperometry data:
Select
the sample in the Browser and then select Open>
3D_Amp from the context menu.
If
the sample is already open in another window (for example, the Integration
window), select 3D Amperometry
from the View menu or click
the  icon on the Method
toolbar.
icon on the Method
toolbar.
 Tip:
Tip:
A real-time plot of the 3D amperometry data
can be displayed online during a run. See  Controlling
Devices from the Control Panel for more information.
Controlling
Devices from the Control Panel for more information.
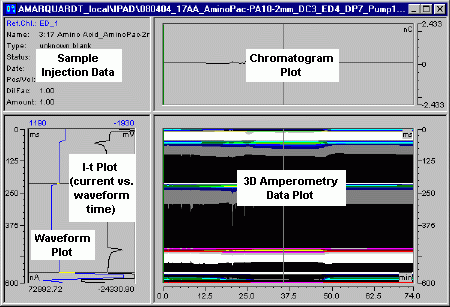
The window is divided into several display
areas. The main area in the lower right displays the raw 3D amperometry
data. The area above the 3D data displays a chromatogram of selected data.
The area to the left of the 3D data displays an I-t plot (current vs.
waveform time) of selected data.
You can use several methods to select the data
displayed on the plots:
Drag
the horizontal and vertical line cursors.
Use
the mouse to zoom into a selected area.
Select
a command (for example, Zoom to Integration
Interval) from the View
or context menu.
To select various plot options (for example,
to switch from integrated to raw data view), select Decoration
from the View or context menu.
For more information, refer to:
Display Areas
Data
Selection
Analyzing
3D Amperometry Data.