Calibration Variable:
Hubaux-Vos Detection Limit (H-V LOD)
The Hubaux-Vos Limit of Detection* is a value that represents the minimum amount of an analyte that can be detected by a method with a specified level of certainty, given a particular set of calibration data.
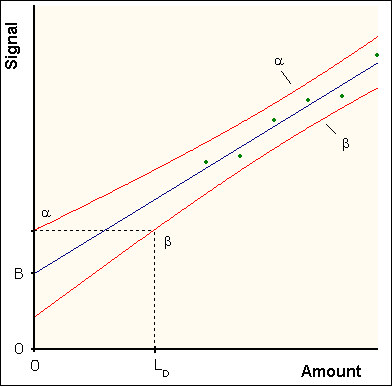
The H-V LOD is derived from selected values of α and β, where α represents the probability of false positives (reporting detection when no analyte is present) and β represents the probability of false negatives (reporting nothing detected when the analyte is actually present). The selected α and β values are used to calculate upper and lower prediction intervals, respectively. Similar to confidence intervals, the prediction intervals are hyperbolic curves bounding the calibration line; they define a region within which a future measurement will have a selected probability of being found.
From the prediction intervals, the H-V LOD is determined by constructing a horizontal line through the intersection of the upper prediction interval (defined by α) and the response axis, then finding the amount that corresponds to the point where the constructed horizontal line intersects the lower prediction interval (defined by β).
(It is important to note the difference between confidence intervals and prediction intervals. Confidence intervals represent an estimate of the behavior of a complete population, whereas prediction intervals predict the distribution of individual points.)
Prediction intervals for H-V LOD calculations can be set independently in Chromeleon. The default upper prediction interval is 99% (which corresponds to an α value of 1%), and the default lower prediction interval is 95% (which corresponds to a β value of 5%).
In Chromeleon, confidence intervals displayed on calibration plots are always symmetric around the calibration curve (for example, a 99.8% confidence interval represents an upper confidence interval of 99.9% and a lower confidence interval of 99.9%). However, Chromeleon report variables can be used to calculate upper and lower confidence limit values using independent settings for the upper and lower confidence intervals. There is no connection between the confidence interval plot display option, the confidence limit report variables, and the H-V LOD report variable.
To set different prediction limits for the H-V LOD variable, select the Parameter button.
![]() Notes:
Notes:
The Hubaux-Vos Detection Limit...
can be computed only for calibration types with an offset, i.e., Linear, Quadratic and Cubic with offset.
is not available for Standard Addition evaluation.
uses mirrored calibration axes for the Inverted curve fitting type, i.e., the x axis becomes the y axis (Response) and vice versa.
*Reference: Hubaux, A.; Vos, G. Anal. Chem. 1970, 42 (8), 849-855.